(updated 7/31/2013)
The Small Trades Portfolio Designer is used to test model portfolios that hold 1-9 sectors of financial market returns plus a cash supply of U.S. dollars. The program is pre-loaded with monthly returns computed from broad market indices during the 15 year period of 1997 to 2011. You create the model portfolio by entering an allocation plan, investment amount, and rebalancing strategy. The results are displayed in tables and charts on the same worksheet. You have the option of assessing the impact of trading costs and investment fund fees on portfolio returns. The program can be downloaded for free by clicking here: SmallTradesPortfolioDESIGNER.
Allocation plan
At the top of the worksheet, each class of securities is labeled according to a unique combination of market region, market sector, and asset class.
Consider, for example, funding a portfolio that is 54% invested in large-cap U.S. stocks, 36% invested in U.S. bonds and 10% stored in cash. For every $100 invested, $54 are allocated to U.S. large-cap stocks, $36 to U.S. bonds, and $10 to a cash reserve. The allocation plan consists of weighting factors 0.54/0.36/0.10 [the article designing a buy-and-hold portfolio offers advice on creating allocation plans relevant to your investment goal]. The following entries are made next to the appropriate labels:
Rebalancing strategy
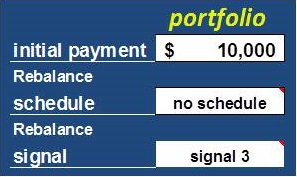
 Suppose the portfolio is funded with $10,000 [comment: lower payments might be less efficient investments when factoring in the costs of trading fees and expense ratios]. Two methods of rebalancing the portfolio are scheduled (e.g., every year) and signaled. Suppose you wish to test the signaled method by choosing “no schedule” from the pull down list of the “Rebalance schedule” cell and “signal 3” from the pull down list of the “Rebalance signal” cell. “Signal 3” is a command to rebalance the portfolio when market forces unbalance the portfolio to an unacceptable degree of error. The result is an intermittent series of rebalancing episodes that modify the historical returns. “Signal 1” and “signal 2” evoke a different number of rebalancing episodes by modifying the boundary for unacceptable allocation error. It’s an empirical process for finding the best result.
Investment costs
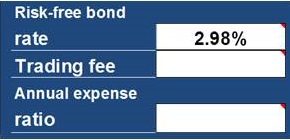
The “risk-free bond rate” is used to calculate the Sharpe ratio. I recommend a rate that estimates the risk free return for the holding period of the test portfolio (e.g., a 10 year Treasury Note at inception of the portfolio). The default bond rate is 2.98% for the 15 year period of this program. Trading fees and annual expense ratios always reduce investment returns, sometimes by a considerable amount. Assess these by entering the typical trading fee charged by your broker and an estimated annual expense ratio derived from investment funds and advisor’s fees. Or consider testing the default costs of $10 for trading and 1% for an annual expense ratio. These entries are left blank for this tutorial.
Results
The historical returns are summarized by statistics and charts for the “Unbalanced” (“buy-and-hold”) and “Rebalanced” portfolio. The outcomes of the “Unbalanced” and “Rebalanced” portfolio would be identical without a rebalancing strategy [furthermore, a portfolio of one asset cannot be rebalanced]. In the following table, “CAGR” is the annualized growth rate of the portfolio’s accumulated returns. “Sharpe ratio” is the average annual investment return adjusted for market fluctuations. A negative Sharpe ratio implies that risk-free U.S. government bonds are better investments. Higher values of CAGR and Sharpe are preferred. The “final value” is the portfolio’s market value at the end of the investment period.
Chart 1 shows the returns based on test conditions. The market fluctuations ultimately reach the final values shown in the table. An effective rebalancing strategy creates a gap between both curves.
Rebalanced portfolio
Rebalancing may not improve the investment performance of a portfolio. However in this example, the signaled rebalancing strategy outperformed the unbalanced portfolio (CAGR 6.59% is better than CAGR 5.65%). Not shown is that scheduled rebalancing “every 3 years” also outperformed the unbalanced portfolio (CAGR 6.38% vs CAGR 5.65%). In this tutorial, the result of selecting “signal 3” for the signaled strategy generated a 37.7% boundary error labeled as the “rebalance signal” in the program.
“Signal 3” also triggered 4 rebalance episodes over 15 years (chart 2) when there were no trading costs at inception or rebalance.
Warning messages
The next chart uses red arrows to show the location of warning messages. These disappear when satisfactory entries are made in the program. Be aware that the “asset allocations” must total 100% or else the blue-lettered message “Allocations are incomplete” reminds you to check the entries.
Applications
The investable securities of the program’s market sectors are index funds, stocks, bonds, real estate investment trusts (REITs), and commodities futures. Index funds are particularly good substitutions for market sectors of the model portfolio.
Test other model portfolios. The 60/40 Stock-Bond Portfolio, exclusive of a 10% cash holding, is a favorite of many investors. The 60/40 unbalanced portfolio’s 6.07% “CAGR” and 0.29 “Sharpe ratio” provides a standard for comparison with other allocation plans. Try creating higher returns by experimenting with different allocations. Consult the article designing a buy-and-hold portfolio for advice on creating allocation plans relevant to your investment goal.
Apply the rebalancing strategy. Either the scheduled or signaled strategy can be used to rebalance a portfolio of index ETFs that match the allocation plan of a model portfolio. The scheduled strategy is straight forward. Simply rebalance the ETFs according the best schedule determined by this program. The signaled strategy is not straight forward. It requires transcribing data from this program to the Small Trades Portfolio REBALANCER program in the following way:
1. Enter the “Rebalance signal” from the Results of this Designer program into step 1 of the Rebalancer program. In this example, the correct entry would be 37.7%.
2. Result 1 of the Rebalancer program will display a “Rebalance” message when any of the portfolio’s ETFs satisfies criteria for correction.
Conclusions
A leap of faith is needed to apply the model portfolio to your investment goals. This program is based on recent 15-year returns and your best bet is to assume that the next 15 years will provide a different investment performance due to market uncertainty. Even so, I don’t know any investor who completely ignores history.
This program tests strategies for rebalancing a model portfolio. I know of no other program that provides such information!
The potential impact of trading fees and fund expense ratios is considerable when many portfolio holdings are rebalanced frequently and the expense ratios are high [that’s why respected authors recommend minimizing costs by seeking high-quality, no-fee, no-load investments]. A good rebalancing strategy should augment the expected return of the unbalanced portfolio.
You can download this program free of charge by clicking on SmallTradesPortfolioDESIGNER. If the program inspires your investing for the betterment of self and society, consider giving a tax-deductible contribution to your favorite charity or my favorite charity.


Hi there everyone, it’s my first visit at this website, and piece of writing is in fact fruitful in favor of me, keep up posting these types of articles or reviews.
Tad, thank you for your comment. Hope your investing is going well, Doug