Selling all or part of a profitable investment is a tough choice to make. On one hand, holding the investment allows time to accumulate a high return, but at the risk of losing profit in the market’s next big decline. On the other hand, selling portions of the investment to ensure a profit today will diminish the future return.
Both choices are easy to illustrate by imagining a stock investment that pays no dividends. Assume there is a consistent growth of stock price and that no additional shares are purchased after the original purchase. The profit is skimmed by selling part of the investment when its market value grows to twice the original purchase. Repeat the process every time the market value doubles until the investment is closed. Chart 1 illustrates the skimming of a $1,000 investment.

chart 1, Market values. $1,000 was invested in a good growth stock that paid no dividends. A generous 15% annual return doubled the market value every 5 years. The HOLD strategy (black squares) was to avoid selling for 20 years. The SELL strategy (green circles) was to sell half the shares every time the market value doubled. There were no trading fees.
After 5 years, the investor could claim a profit of $1,000 on the original $1,000 investment. Then the choices would be to close the investment at $2,000, withdraw only the $1,000 profit and wait for more (green circles), or withdraw nothing and wait for a bigger profit (black squares). The largest profit is made by waiting 20 years.
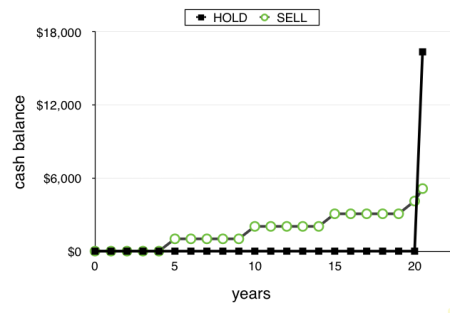
Chart 2 illustrates the accumulated cash balances of the HOLD and SELL strategies.

chart 2, Cash balances. The cash balances of both strategies in chart 1 are illustrated in this chart using the same symbols for data points. The proceeds from every sale were held in a cash account and allowed to accumulate for 20 years. After 20 years, the remaining shares were sold for cash. The end point of each strategy is the final cash balance.
After closing the investment in 20 years, the accumulated cash balance would be $16,367 from the HOLD strategy and $5,045 from the SELL strategy.
Alternate conditions
The accumulated cash balance will vary according to the annual rate of return (appended chart 3), the amount skimmed (appended chart 4), and the payment of dividends (appended chart 5). In every condition, the total profit of the HOLD strategy exceeds the total profit of the SELL strategy.
Conclusion
On the question of whether or not to skim profits, skim if you need cash in the next 5-10 years. Otherwise, don’t sell without reassessing the investment or using a risk management scheme. The question of selling for a loss was excluded from this discussion; that’s a different topic.
Appendix: Tables of cash balances
Charts 3-5 are tables of cash balances that represent profits from an imaginary investment of $1,000. The choices for taking a profit were to HOLD the investment for 20 years before liquidating the account or to SELL profitable portions of the investment. Assume there were no trading fees.
Chart 3 shows that a 15% annual rate of return earned a bigger profit than a 7% annual rate of return. Furthermore, the HOLD strategy earned a larger profit than the SELL strategy at both rates of return.

chart 3, Rate of return. $1,000 was invested in a good growth stock that paid no dividends. No shares were purchased after the original investment. The 20-year cash balance (cells) was only affected by the annual rate of return (rows) and liquidation strategy (columns). The HOLD strategy did not sell shares for 20 years. The SELL strategy sold half the shares whenever the market value doubled in size during the 20 year period. The 7% rate permitted 1 selling period and the 15% rate permitted 4 selling periods.
Chart 4 illustrates the effect of skimming 50%, 100%, or 150% increments of market value.

chart 4, Increments of market value. $1,000 was invested in a good growth stock that paid no dividends. The investment’s annual rate of return was 15% and no shares were purchased after the original purchase. The cash balances (cells) accumulated every time period (rows) among 3 different increments of market value (columns). The HOLD strategy did not sell shares for 20 years. The ‘rule’ for the SELL strategy was to sell a portion of shares when the market value grew by approximately 50% every 3 years ($521), 100% every 5 years ($1,011), or 150% every 7 years ($1,660).
The HOLD strategy outperformed the SELL strategy. With the SELL strategy, waiting longer to skim bigger profits accumulated a larger cash balance after 20 years. Why? The bigger profits were less frequent, which had the effect of preserving the investment’s principal for longer time periods.
Chart 5 reveals a surprising effect for skimming profits from reinvested dividends.

chart 5, Dividends. $1,000 was invested in a good growth stock that paid a 2% dividend on every share. No shares were purchased after the original investment unless the dividends were automatically reinvested. The cash balances (cells) accumulated with the passage of time (rows) among 3 types of investments (columns). The HOLD strategy did not sell shares for 20 years. The SELL strategy removed half the remaining shares every 5 years.
There were no surprises in the HOLD strategy. Reinvested dividends accumulated the largest cash balance over 20 years. However, reinvested dividends accumulated the lowest cash balances in the SELL strategy. Why? Slightly more shares were sold every 5 years from ‘reinvested dividends’ compared to ‘no dividends’. Yet the same number of shares were sold from ‘cash dividends’ compared to ‘no dividends’. The cash dividends directly augmented the cash balances.
Copyright © 2017 Douglas R. Knight