The SmallTrades Portfolio holds cash plus an exchange-traded fund (ETF) and a folder of stocks (figure 1).
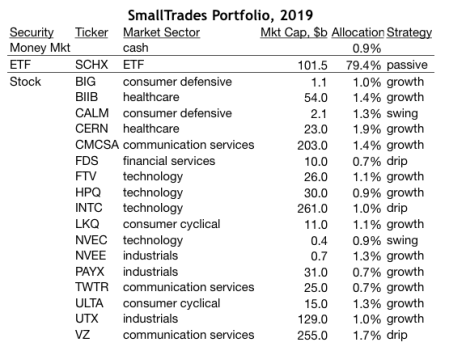
Figure 1 displays 2019’s year-end composition of the SmallTrades Portfolio. COLUMN HEADINGS: “Ticker” is the trading symbol of the “Security” as listed in the U.S stock exchange. “Mkt Cap” stands for ‘market capitalization’, which is the total market value for all tradable shares of a given security. “Allocation” is the percentage market value of each holding relative to the market value of all holdings in the Portfolio. “Strategy” is the investment strategy. STRATEGY: “Passive” strategy relies on the ETF’s computers to track the value of a selected market index. “Drip” signifies the automatic reinvestment of dividends earned from long term investments in ETFs and stocks. “Growth” stocks are expected to earn long term capital gains. “Swing” stocks are expected to earn short- or long term capital gains based on a pre-defined range of price growth.
Strategy
The investment goal of the Portfolio is to earn an annual rate-of-return that surpasses the performance of the benchmark Standard & Poors 500 Stock Index. One index-ETF dominates the Portfolio’s return with an expectation of matching the benchmark’s rate of return. A subordinate folder of selected stocks is expected to outperform the benchmark’s annual rate-of-return.
Performance
The Portfolio earned a 29.7% total rate-of-return during calendar year 2019. Although the Standard & Poors 500 Index earned a higher rate of 31.5% in 2019, I’m pleased with the Portfolio’s performance for these reasons:
- 2019 was the first year that the Portfolio’s market value surpassed the initial market value at year-end 2007 (figure 2). As reported in an earlier post, the market value declined in 2008 due to mismanagement, then took 12 years to recover by the process of employing trial-and-error strategies of management. The strategies gradually improved to the current idea of using an index-ETF to earn the benchmark return and supplementing that return with a subfolder of growth stocks.
- Converting 2018’s diversified ETF folder to 2019’s single ETF successfully raised the ETF folder’s market value by 33.9% in a single year (figure 3).
- Revising both the investment strategy and the composition of 2018’s stock folder raised its market value by 54.9% (figure 3).
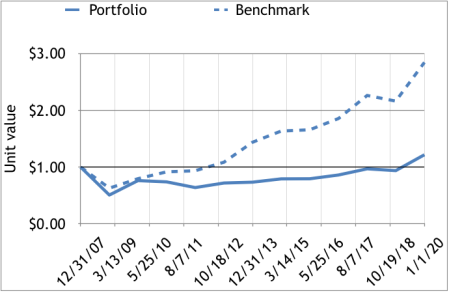
Figure 2.
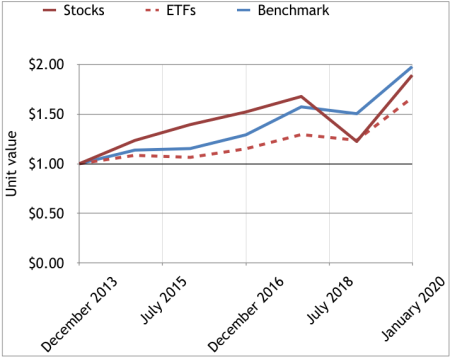
Figure 3.
Copyright © 2020 Douglas R. Knight
