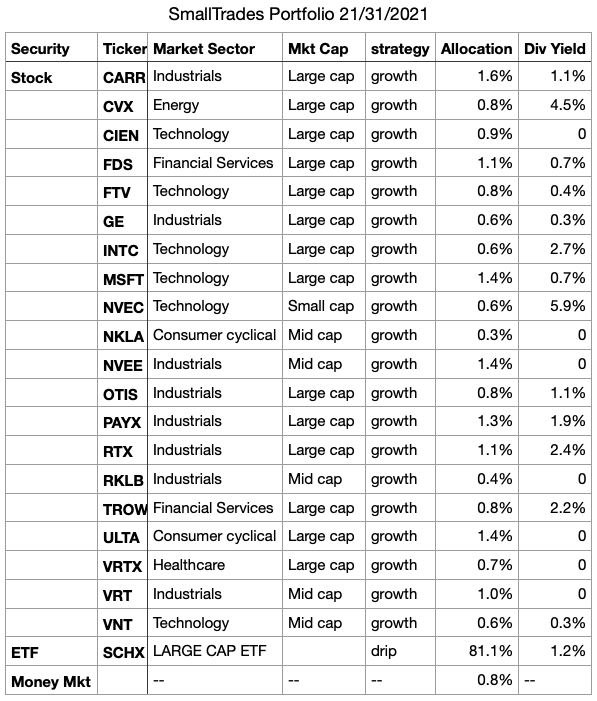
My private SmallTrades Portfolio is a Roth Account in which I no longer make annual contributions and cash withdrawals. Calendar year 2021 marked the 14th year of active portfolio management. Figure 1 shows the latest portions of year-end market value as 81% index-ETF, 18% U.S. stocks, and 1% money market.
Fig 1.
Annual returns
My investment goal is to earn an annual rate of return above that of the benchmark Standard & Poors 500 Stock Index. Unfortunately, the Portfolio usually underperforms the Benchmark.
Fig 2.
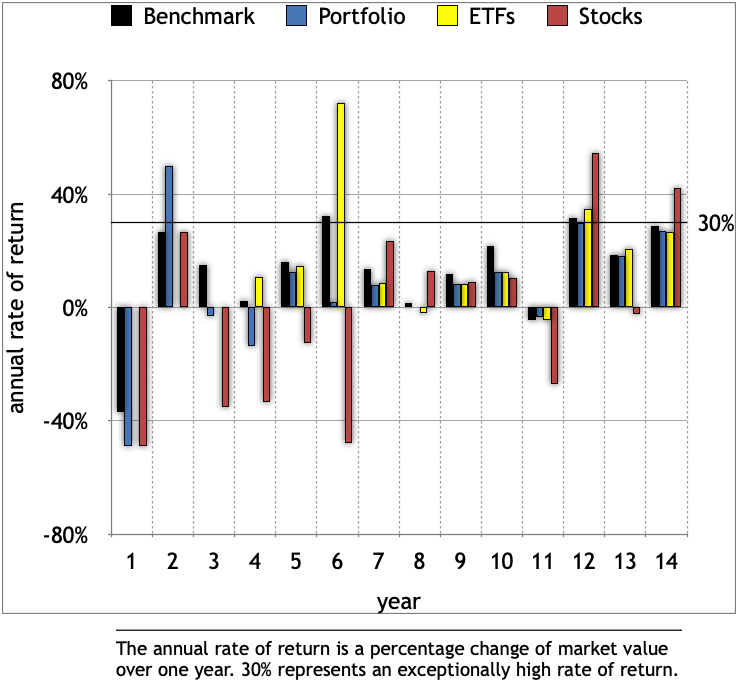
Figure 2 presents the history of annual returns for the Portfolio (blue bars), portfolio holdings (yellow & red bars) and Benchmark (black bars). In year 14, the Portfolio earned a 27% rate of return compared to the Benchmark’s 29% rate of return, thus underperforming the Standard & Poors 500 Index by a margin of 2%. The history of annual returns reveals devastating losses of market value in the first 6 years followed by encouraging gains in the last 8 years. Speculation and hurried trading, augmented by the 2008 Recession in year 1, created multi-year losses. After year 6, reduced speculation and slower trading produced multi-year gains.
14-year growth
Devastating losses of Portfolio value in the first 6 years precluded any chance of matching the cumulative growth of the Benchmark over 14 years.
Fig. 3.
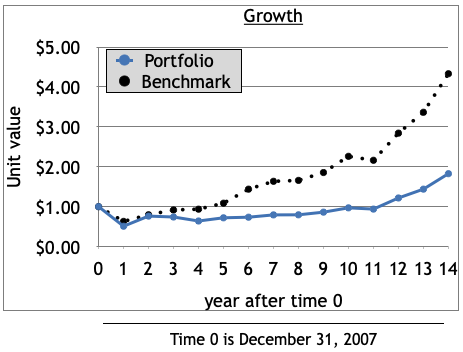
Figure 3 displays the cumulative growth of annual returns as a chain of “unit” market values. The unit market values of the portfolio (blue dots) are ratios of year-end market value to the initial market value at time 0. After 14 years, the Portfolio’s compound annual growth rate reached 4% compared to the Benchmark’s 11%.
8-year growth
To evaluate the cumulative growth of annual returns in the last 8 years, I reset the unit value to $1.00 at the end of year 6 and recalculated the succeeding unit values now displayed in figure 4.
Fig. 4.

Less speculation coupled with longer holding periods enabled Stocks (red dots) to outperform the Benchmark (black dots) through year 10 and generally outperform the Portfolio (blue dots). The Portfolio (blue dots) matched the performance of its ETF (yellow dots).
Summary
Measurements of annual return and cumulative growth show that the SmallTrades Portfolio continues to underperform its Benchmark by a wide margin of 7% cumulative growth over 14 years. The last 8 years produced encouraging results based on improvements in portfolio management. To continue improving, but not wishing to leverage my investments, my choices are to invest in a growth index ETF and/or re-allocate assets to a higher portion of growth stocks in the portfolio.
Copyright © 2021 Douglas R. Knight
