Summary: New investors might find it helpful to understand the basic language of the Stock Market. In this article I discuss the basic vocabulary as it relates to practical ideas for personal investing. Links are provided for further reading about a particular topic.
Investment returns
An investment is the payment of capital to earn a return. The return is a gain (or loss) of value in the investment. Taxes on returns are regulated by the Internal Revenue Service (I.R.S.) and local governments.
- Principal: the amount of money invested.
- Capital: the cash or goods used to generate income.
- Capital gain (or loss): the increase (or decrease) in cash value of an asset.
- Dividend: a company’s cash payment to its stockowners.
- Interest: the borrower’s cash payment to the lender that is added to the principal of the loan.
Investment portfolio
Financial assets are potential sources of income for investors. Asset classes are groupings of assets that earn income in uniquely different ways. The most popular asset classes are Equities and Fixed Income Securities. Equities earn income by the sale of a security (e.g., shares of a Stock). Fixed Income Securities earn guaranteed interest (e.g., bonds) or guaranteed dividends (e.g., preferred stocks). Securities and investors are regulated by the Securities & Exchange Commission (S.E.C.).
- Securities: contracts that require an investment of money to generate profits from the efforts of other people.
- Stock: a security that represents part ownership of a company.
- Common stock: a security that entitles its owner to vote on important issues, collect dividends, and earn capital gains from the stock market.
- Preferred stock: a security that entitles its owner to receive dividends before dividends are paid to owners of the company’s common stock. Preferred stockowners have no voting rights.
- Bond: the debt that requires a company to return an investor’s principal, plus interest, by the date of maturity.
A Portfolio is the investor’s collection of financial assets called holdings. By comparison, an Investment Fund is a portfolio of financial securities which are professionally managed on behalf of the fund’s investors. Famous examples are mutual funds and exchange-traded funds (ETFs). An actively managed portfolio generally seeks to earn higher returns than one which is passively managed. The passively managed portfolio seeks to duplicate the returns of a market index.
- Market index: a hypothetical portfolio designed to measure the value of a market or market segment.
- ETF: an Investment Fund that sells shares of the fund in the stock market. Index ETFs are passively managed.
Stock market
A new stock is issued in its primary market. The primary market is a private assembly of the company’s founders, venture capitalists, and third parties such as banks and advisors. The stock may later be sold by public auction in the secondary market. The secondary market is the familiar stock market where millions of investors, —like us!—, trade cash for stocks and other exchange-traded securities (e.g., ETFs).
Trading orders
The stock market participants include Investors who make offers, Brokers who generate orders, and Traders who finalize orders. The broker’s trading platform is a computer program that assists investors with placing trading orders. The platform provides a market “quote” comprised of the current purchasing price (the “bid”), sales price (the “ask”), last-traded price, and latest number of traded shares (the “volume”). On any day there may be millions of orders to buy and sell in the stock market. Orders are filled at the market price determined by an auction of shares conducted by the broker’s trader. Brokers and traders often charge a fee for their services. Custodians are hired by brokers to store traded securities in electronic accounts on behalf of investors.
The simplest trading order, a MARKET ORDER, specifies the number of shares to be traded. Market orders are filled immediately provided the shares are available; otherwise, the order remains open until shares are available. Conditional limit- and stop orders are stored in computers until activated or expired at the end of a period called the time-in-force. The LIMIT ORDER requires an investor to specify a preferred price for the trade. Limit orders are activated when the market price reaches the preferred price and then filled at the preferred price or a better price. Please be aware that a sudden market event could displace the market price outside the limit range of an activated order, in which case the limit order is cancelled unfilled. The STOP ORDER is activated at a specified price after which it is converted to a market order to be filled immediately regardless of the next available price.
Stock market index
Analysts like to follow the price trend of stocks by graphing a representative number called the stock market index. The index rises and falls at any moment according to fluctuations in share prices during stock market transactions. An influential sales surge moves prices downward and a buying surge generally sends prices upward.
Daily index values are strung together to form an observable trend called the market cycle. The long market cycle is comprised of a “bull” market followed by a “bear” market. The short market cycle is either a rally or a correction. Spikes and crashes are brief events caused by a sudden, large change of the index (chart 1).
- Bull market: a 20% rise of the market index over 2 months or more.
- Bear market: a 20% fall of the market index over 2 months or more.
- Rally: a rise of the market index due to a burst of buying that subsides after the money is spent.
- Correction: a 10% decline of the market index over 2-10 days.
- Spike: a sudden large upward or downward price movement.
- Crash: a sudden correction that lasts 1-2 days.
- Circuit breakers: programmed halts of trading designed to offset a downward plunge of stock prices.
Chart 1. Long and short cycles of the Dow Jones Industrial Average (“DOW”).
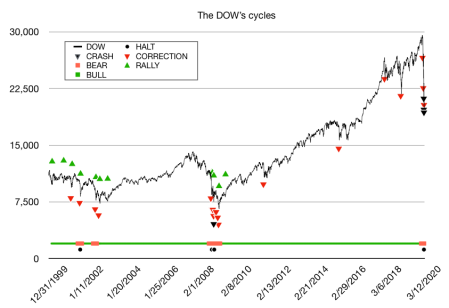
In chart 1, the vertical scale shows values of the DOW Index during a 20 year time period shown by the horizontal scale. The jagged line represents daily fluctuations of market prices. Green, red, and black symbols illustrate the timing of various market cycles and events. The horizontal line of green and red segments portrays 4 long cycles of the DOW Index. After the partial 1st cycle (Jan 2000-Jul. 2001), the complete 2nd (Oct. 2001-Aug. 2002) and 3rd cycles (Sep. 2002-Mar. 2009) show orderly sequences of bull and bear markets. The nearly complete 4th cycle began with a very long bull market of eleven years (Mar. 2009- Jan. 2020) that recently reverted to a bear market at the time of this writing. Chart 1 also shows short cycles of rallies (green triangles) and corrections (red triangles). A few market crashes (black triangles) in Nov. 2008 and Mar. 2020 represent 1-2 day periods of a 10% drop in the Index. Rapid declines of the Index by 7% in one day triggered temporary halts of trading (black circles) known as “circuit breakers”.
Diversification
Stocks are high risk investments with respect to potential capital gains (upside risk) and losses (downside risk). Capital loss occurs when the company declares bankruptcy or its share prices decline. Stock diversification, dollar cost averaging, and dividend reinvestment plans (DRIPs) are effective strategies for managing the common risks of stocks. Monthly purchases of a Stock-index Fund accomplish these strategies. Chart 2 illustrates the potential capital gains from investing in a Stock-index Fund that duplicates a broad market index such as the S&P 500.
Chart 2. Historical prices of the S&P 500 Index.
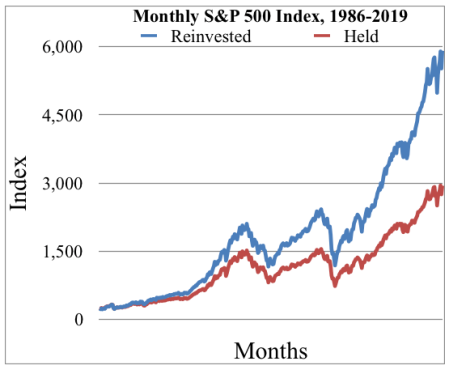
Assuming that the Fund matches the performance of the S&P 500 Index, the difference between holding the original investment in the Fund without further action (red graph) and augmenting the holding with reinvested shares (blue graph) illustrates the potential benefit of a dividend reinvestment plan. In this example, the benefit became ‘significant’ after 6 years.
Postscript
Stock investing is a time-consuming process that might not interest many people who wish to put their money in the market. They can save time (and money) by investing in a Stock-index Fund that provides an instant portfolio of diversified stocks for long term investment.
Stocks are one of several investable asset classes. People with short term goals should consider diversifying their portfolio with different asset classes.
Copyright © 2020 Douglas R. Knight


 Posted by active senior investor